I was reminiscing early this week about the days that I just spent hours in Tableau with Wyscout data and making scatterplots for the life of it. I think Twitter specifically saw more scatterplots than ever before from football data enthusiasts. Then, it made me think: how did we try to find the best performing players?
Immediately, my mind turns toward outliers. It’s a way to look for the players that stand out in certain metrics. One of my favourite pieces on outliers is this one by Andrew Rowlin:
Finding Unusual Football Players – update 2024 – numberstorm blog
Outlier detection for football player recruitment: an update
In this article, I will focus on a few things:
- What are outliers in data?
- Anomalies: contextual anomaly
- Data
- Methodology
- Exploratory data visualisation
- Final thoughts
Outliers
Outliers are data points that significantly deviate from most of the dataset, such that they are considerably distant from the central cluster of values…
Anomalies
Anomalies in data refer to data points or patterns that deviate significantly from the expected or normal behavior…
Contextual anomaly
There are three main types of anomalies: point anomalies, contextual anomalies, and collective anomalies…
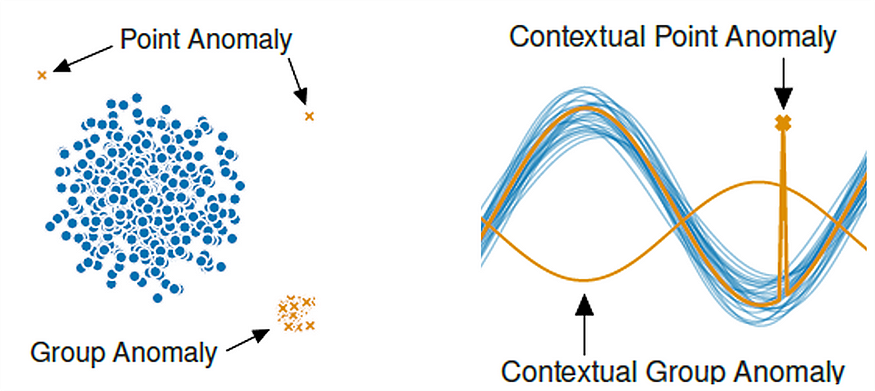
For my research, I will focus on contextual anomalies…
Data
The data I’m using for this part of data scouting comes from Wyscout/Hudl…
Methodology
Before we go into the actual calculation for what we are looking for, it’s important to get the right data…
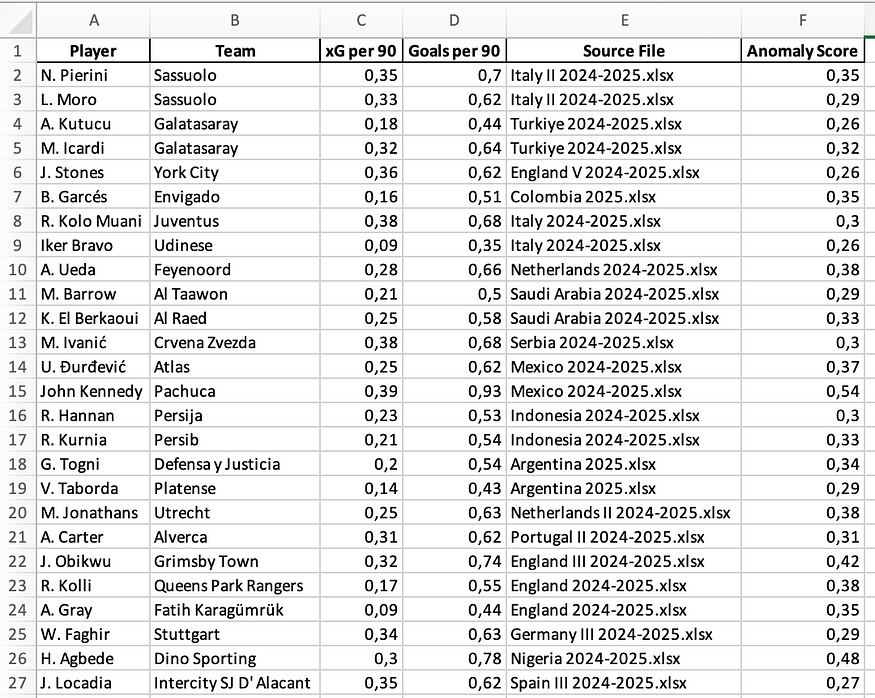
- The context variable: xG per 90
- The target variable: Goals per 90
- Contextual anomaly: when Goals > xG + threshold, but only for low xG
You can also do it statistically and work with z-scores…
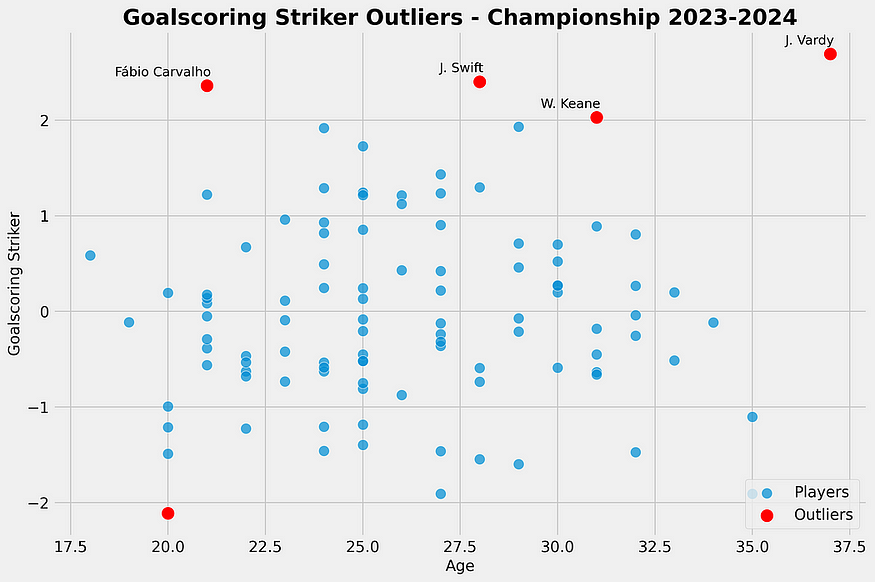
As we can see in our scatterplot, we see Carvalho, Swift, Keane and Vardy as outliers…
Data visualisation
In essence an anomaly in this context is when a player has low(er) xG but has significantly higher Goals…
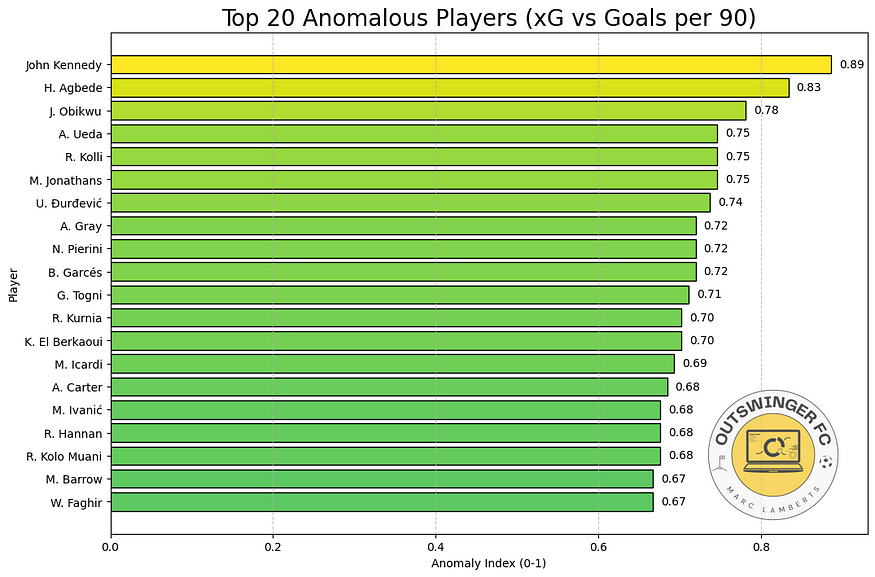
In the bar chart above, you can see the top 20 players based on anomaly index…
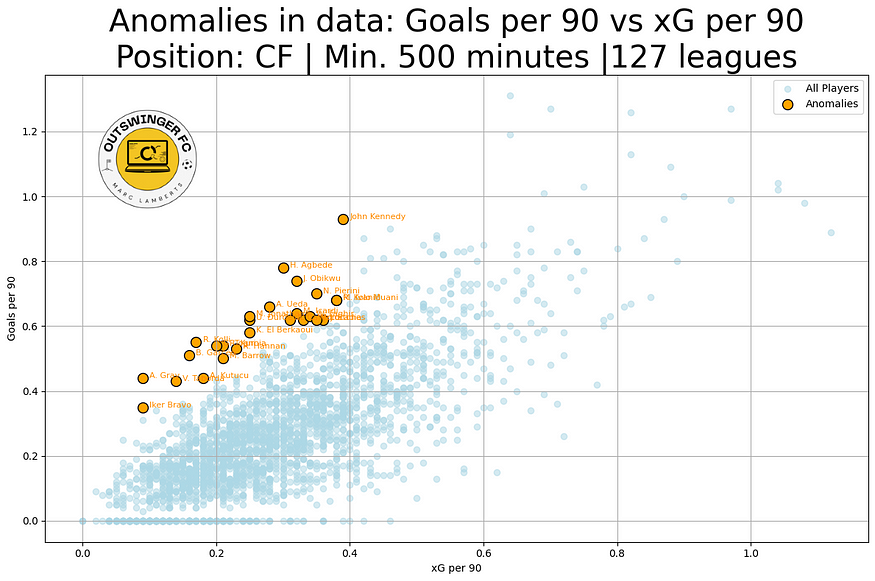
In this scatterplot you can find all players that are within our criteria…
Final thoughts
Anomaly data scouting could be used more…
This way of doing things gives clubs a solid foundation to make smarter decisions…
At the end of the day, anomaly detection isn’t some magic wand that’ll solve everything, but it’s definitely a powerful tool.