I can’t be the only one who feels like this from time to time. I have hit the wall in terms of creating or developing completely new things. Whether it’s a new article or metric or model or a way to analyse games from an eyes perspective — we all get fatigued if we overexpose to the game. It’s fair to say that I have been feeling like this for quite a while actually. I love to innovate and challenge myself, but sometimes we need to ask ourselves: Do we need something completely new?
In that light, I have been looking at work that has already been done and used by so many (Expected goals) and tried to give my own twist to already existing research.
What I want to do is to use this concept and work it out. I want to delve deeper into it and make some meaningful analysis based on data. My aim has two sides:
- I want to understand more about this kind of data concept and how we can work with it
- I want to see which teams perform best in even-strength conditions based on their shot data.
Data
The data I have used in this research is quite straightforward and in line with my other articles. The data comes from Opta/StatsPerform and is event data. This means that it looks at the xy-locations of on-ball events during specific games or seasons. The data was collected on March, 7th 2025, and any further updates haven’t been taken into account.
The expected goal data is generated through my own xG model and has been made through machine learning. From this specific model, I get xG, PsxG, xA, and PSxA. These are different and less detailed/complicated compared to the other providers out there, but the margin for error or difference is quite low, so I’m going to work with my own data here.
Mean Even Strength Football
In ice hockey, “even strength” refers to gameplay when both teams have the same number of skaters, typically five skaters plus a goaltender for each team (5-on-5). This is considered the standard playing condition during most of the game unless one or both teams are serving penalties, which leads to power play or penalty kill situations. Even strength is crucial for evaluating a team’s overall performance since it excludes the influence of special teams.
Several key statistical variables are associated with even strength play. One of the most important is ESG (Even Strength Goals), which measures the number of goals a team scores under these conditions. We can also look at this from an expected angle, focusing on the expected goals and expected assists under even strength standards.
With the selected data I have, I will calculate the filters I’m using:
- Gamestate == Draw
- xG
- From RegularPlay
As you can see, I also selected from RegularPlay or open play. I have made sure to not look at set pieces. They are not nearly the same as power plays, of course, but they are not standard and can be infrequent as well, so that’s why I made that decision.
If we have that data, we are going to calculate the mean. What is the mean?
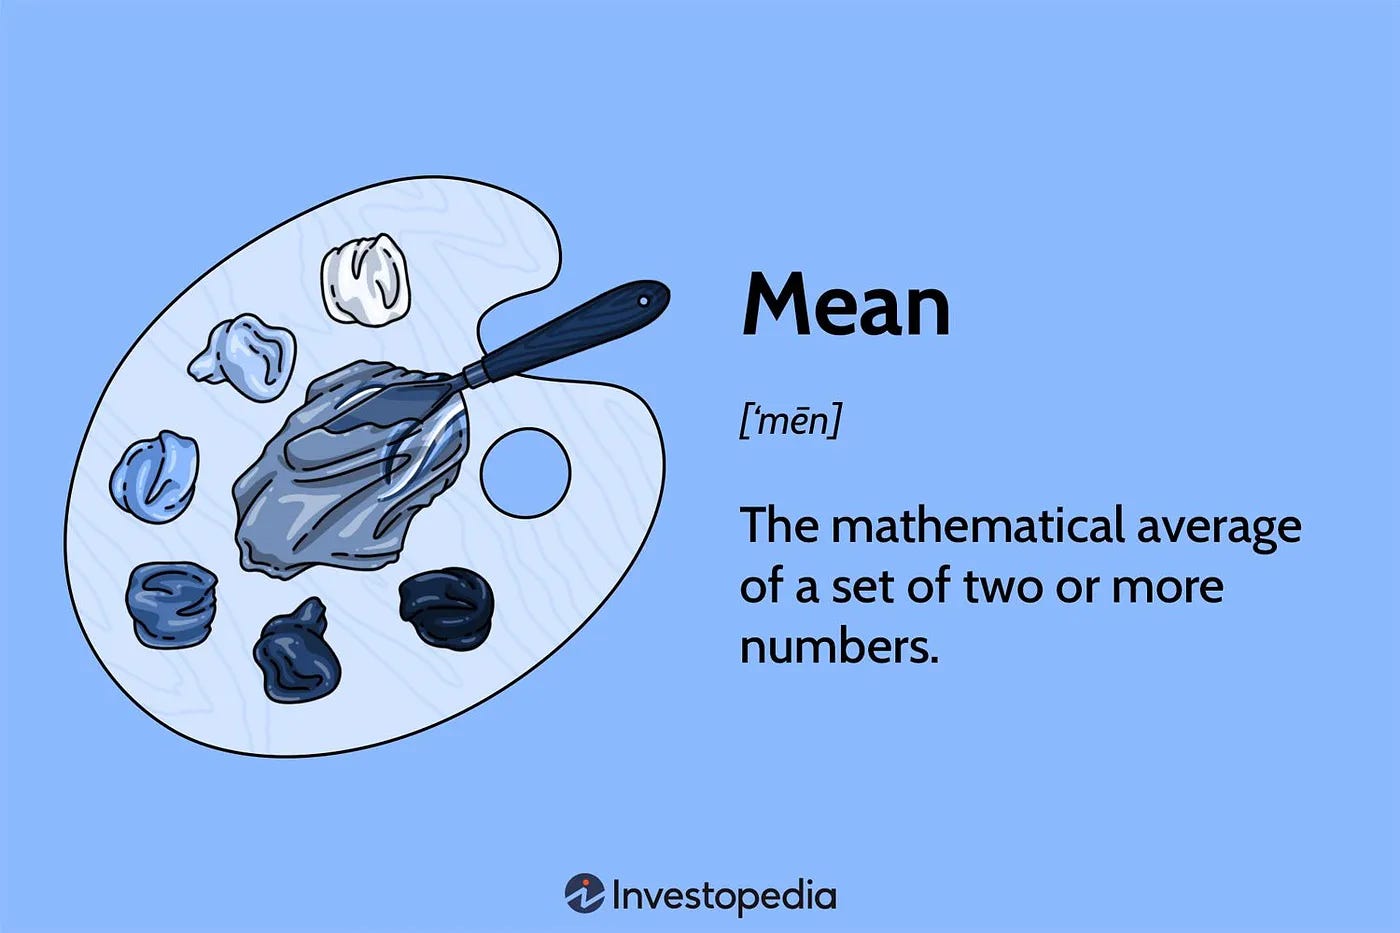
The mean is the mathematical average of a set of two or more numbers and is seen as the average. The mean provides a quick way to understand the “typical” value in a data set, but it can be sensitive to extreme outliers.
When we look at the MESF for Premier League 2024–2025, we can see who the top performers are for players:
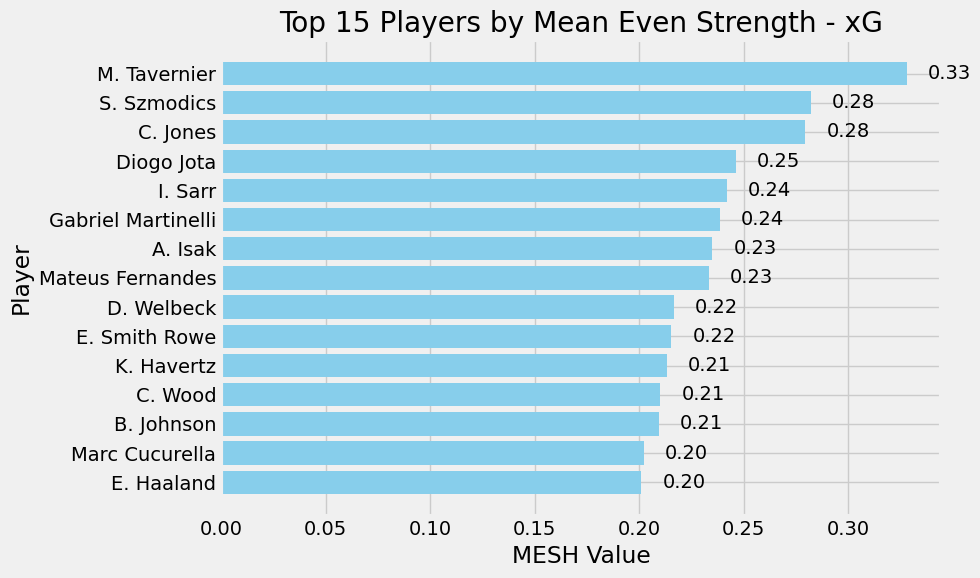
The primary objective was to extract key performance metrics from the dataset, including expected goals (xG), post-shot expected goals (PsxG), and expected assisted goals (xAG), while structuring the data based on individual players and their respective teams.
Probability Even Strength Index
To make the analysis more accurate, the data was filtered based on game state and type of play. Only moments when the game was tied and classified as regular play were considered. This ensured that MESH calculations were based on stable, even-strength conditions. If no records matched these criteria, the entire dataset was used as a backup to prevent data loss.
The MESH Total Score was calculated by adding up all xG values that met these conditions. Additionally, the mean and standard deviation of xG were measured to get a sense of consistency. From these values, the coefficient of variation (CV) was determined, providing insight into how much a player’s xG fluctuated. To account for assists, the MESH Assists score was created by summing up xG values where a player was involved in setting up a goal under the same even-strength conditions.
To better capture a player’s overall impact, the MESH Index was introduced. This was calculated as the sum of a player’s MESH Total and MESH Assists, divided by their total xG and xAG, plus a tiny number (1e-6) to prevent errors from dividing by zero.
Finally, to summarise a player’s contribution in a single number, the MESH Strength Score was developed. This score uses a weighted formula that balances different aspects of performance, ensuring that goal-scoring, assists, consistency, and overall impact are all taken into account. The formula is:

where w1, w2, w3, w4, w5, and w6 are adjustable weights that allow fine-tuning of the score to reflect different performance characteristics.
ELO Rating System Implementation
To measure team performance over time, an ELO rating system was used, with updates based on the MESH Strength Score. The dataset was sorted by Date to make sure ratings were updated in the correct order. Every team started with a default ELO rating of 1500, which acted as the baseline for future changes.
On each match date, all teams that had recorded data were identified. If a team appeared for the first time, it was automatically given the starting 1500 rating. From there, ELO updates were made by comparing a team’s MESH Strength Score to the average score of its opponents. The expected performance score of each team was then calculated using the standard ELO formula:
In this formula, E_team represents the probability of a team performing better than its opponents, R_team is the team’s current ELO rating, and R_opponent is the average ELO rating of all opposing teams.
The actual score (S_team) was determined by comparing a team’s MESH Strength Score to the average score of its opponents. If a team’s MESH Strength Score was higher than the opponent average, it was given a score of 1. If it was the same, the score was 0.5, and if it was lower, the score was 0.
With both the expected and actual scores calculated, the ELO rating was updated using the formula:
where K=32 is the K-factor, which controls the rate of ELO adjustments. A higher K-value results in greater rating fluctuations, while a lower value stabilizes rankings over time.
Analysis
With our data on a team level, I want to see what the index does in terms of rating on an ELO-based ranking. The PESI is used for every match day, and we follow the trajectory of a team.
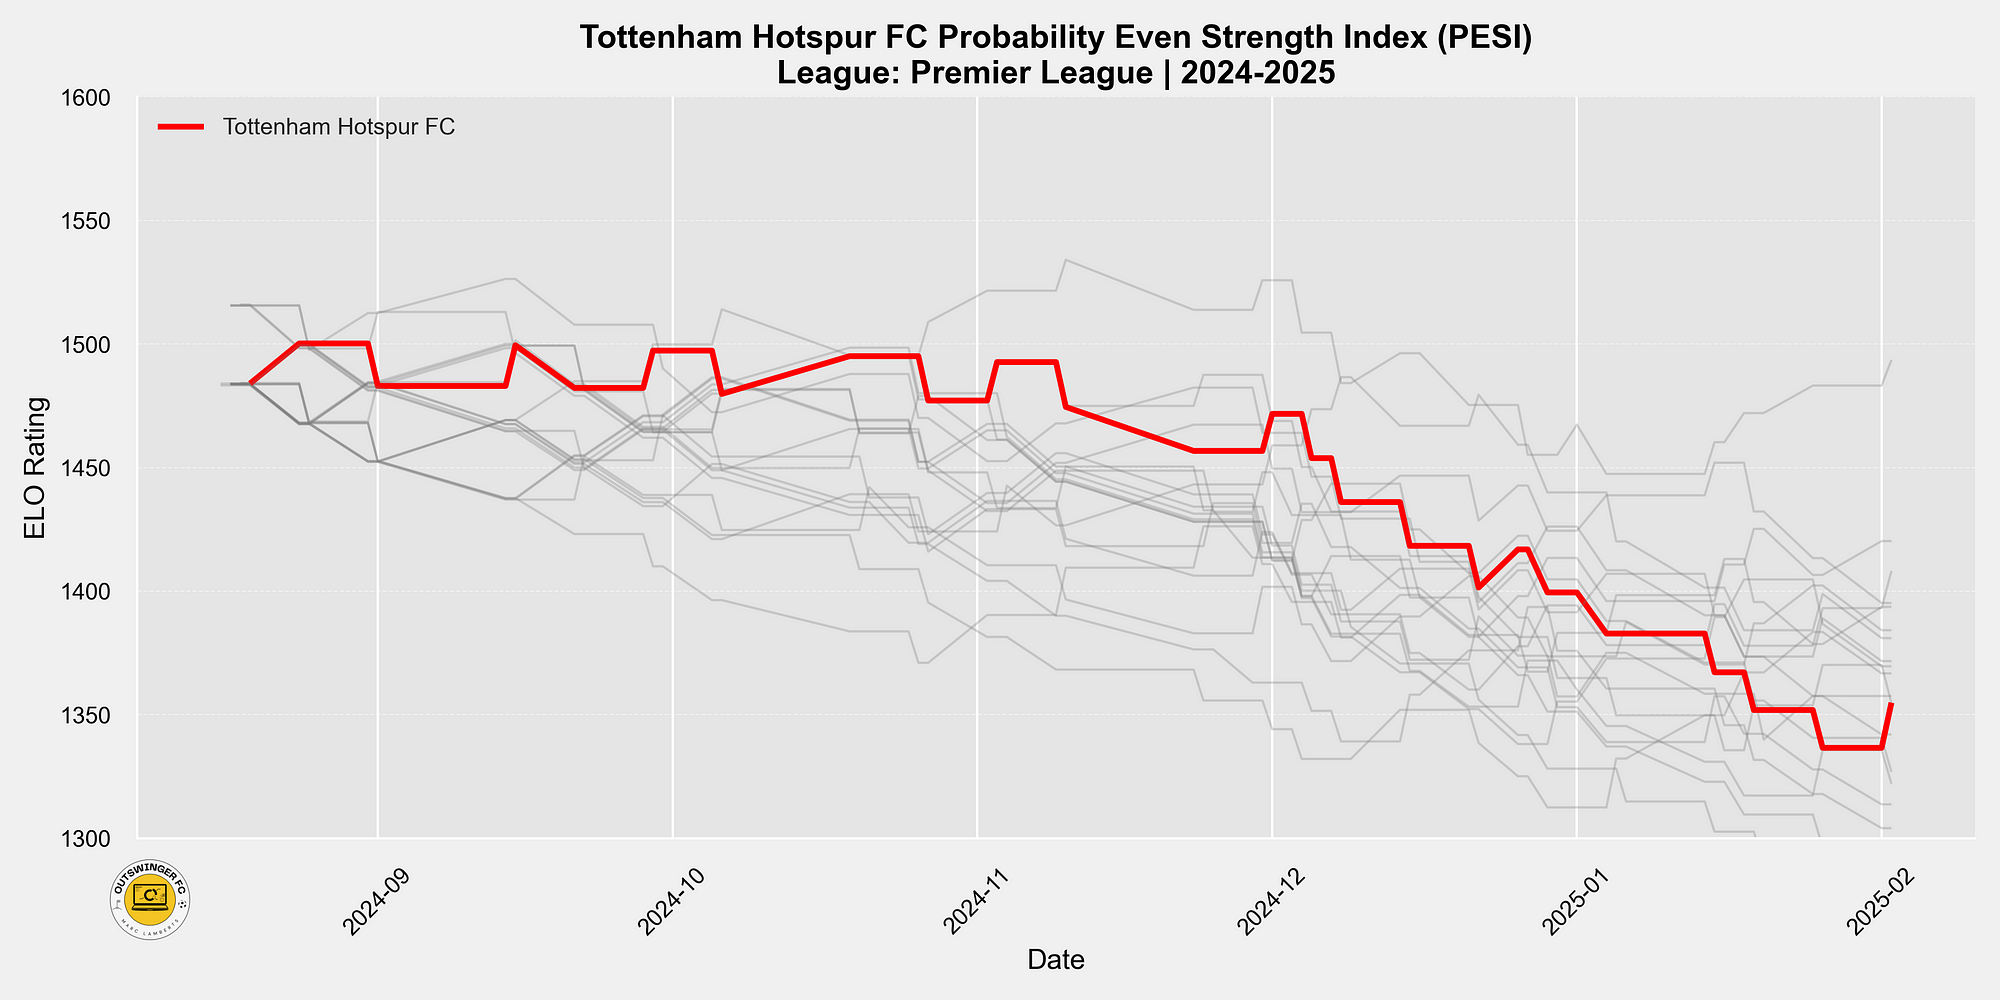
In the line graph above, we see all Premier League teams in the 2024–2025 season with their PESI per matchday. We have made our focus team Tottenham Hotspur red to see what the focus team is doing in comparison to the rest of the league. Tottenham started with an ELO ranking of 1484, and as of March 5th 2025, their ELO ranking is 1355.
Let’s have a look at Liverpool, the current leaders of the Premier League. How are they doing in even-strength situations?
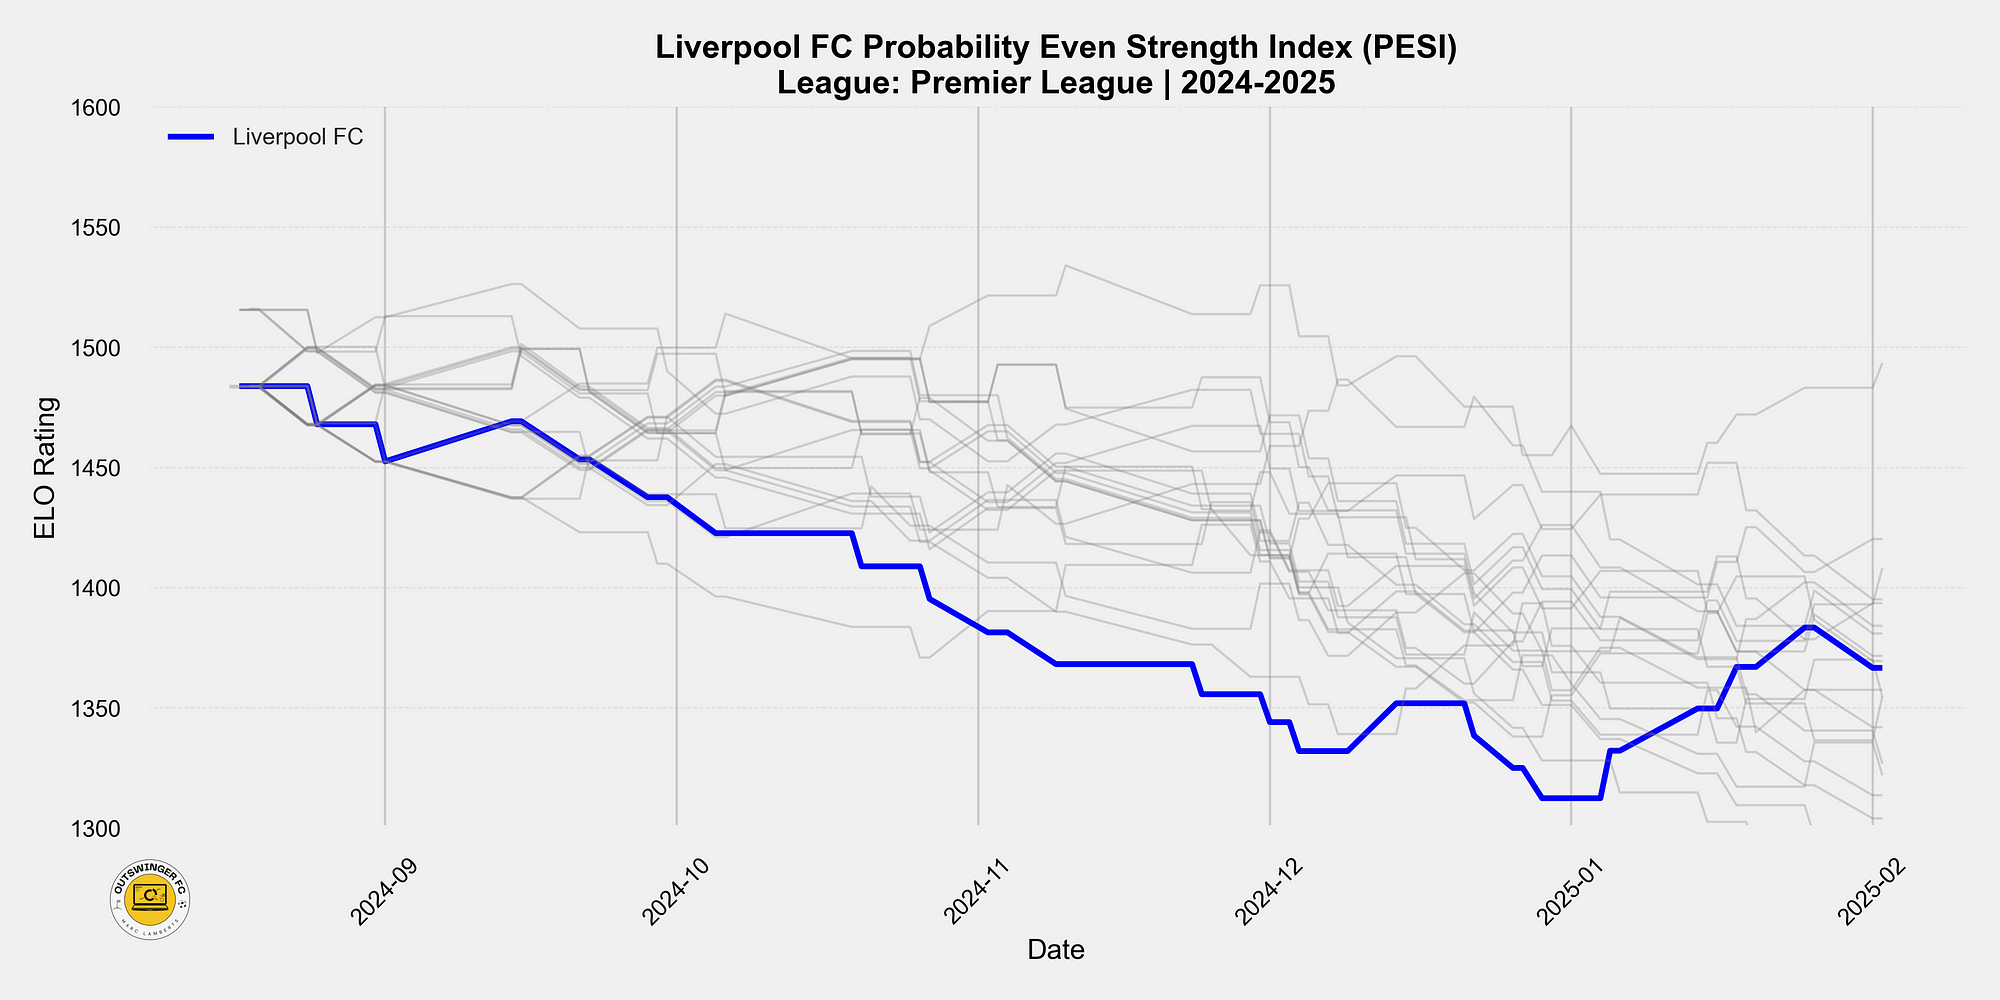
In the line graph above, we see all Premier League teams in the 2024–2025 season with their PESI per matchday. We have made our focus team Liverpool blue to see what the focus team is doing in comparison to the rest of the league. Liverpool started with an ELO ranking of 1484, and as of March 5th 2025, their ELO ranking is 1366.
We see two different teams with the same start point who are quite similar in the way they look with their rating right now. What’s the actual ranking right now?
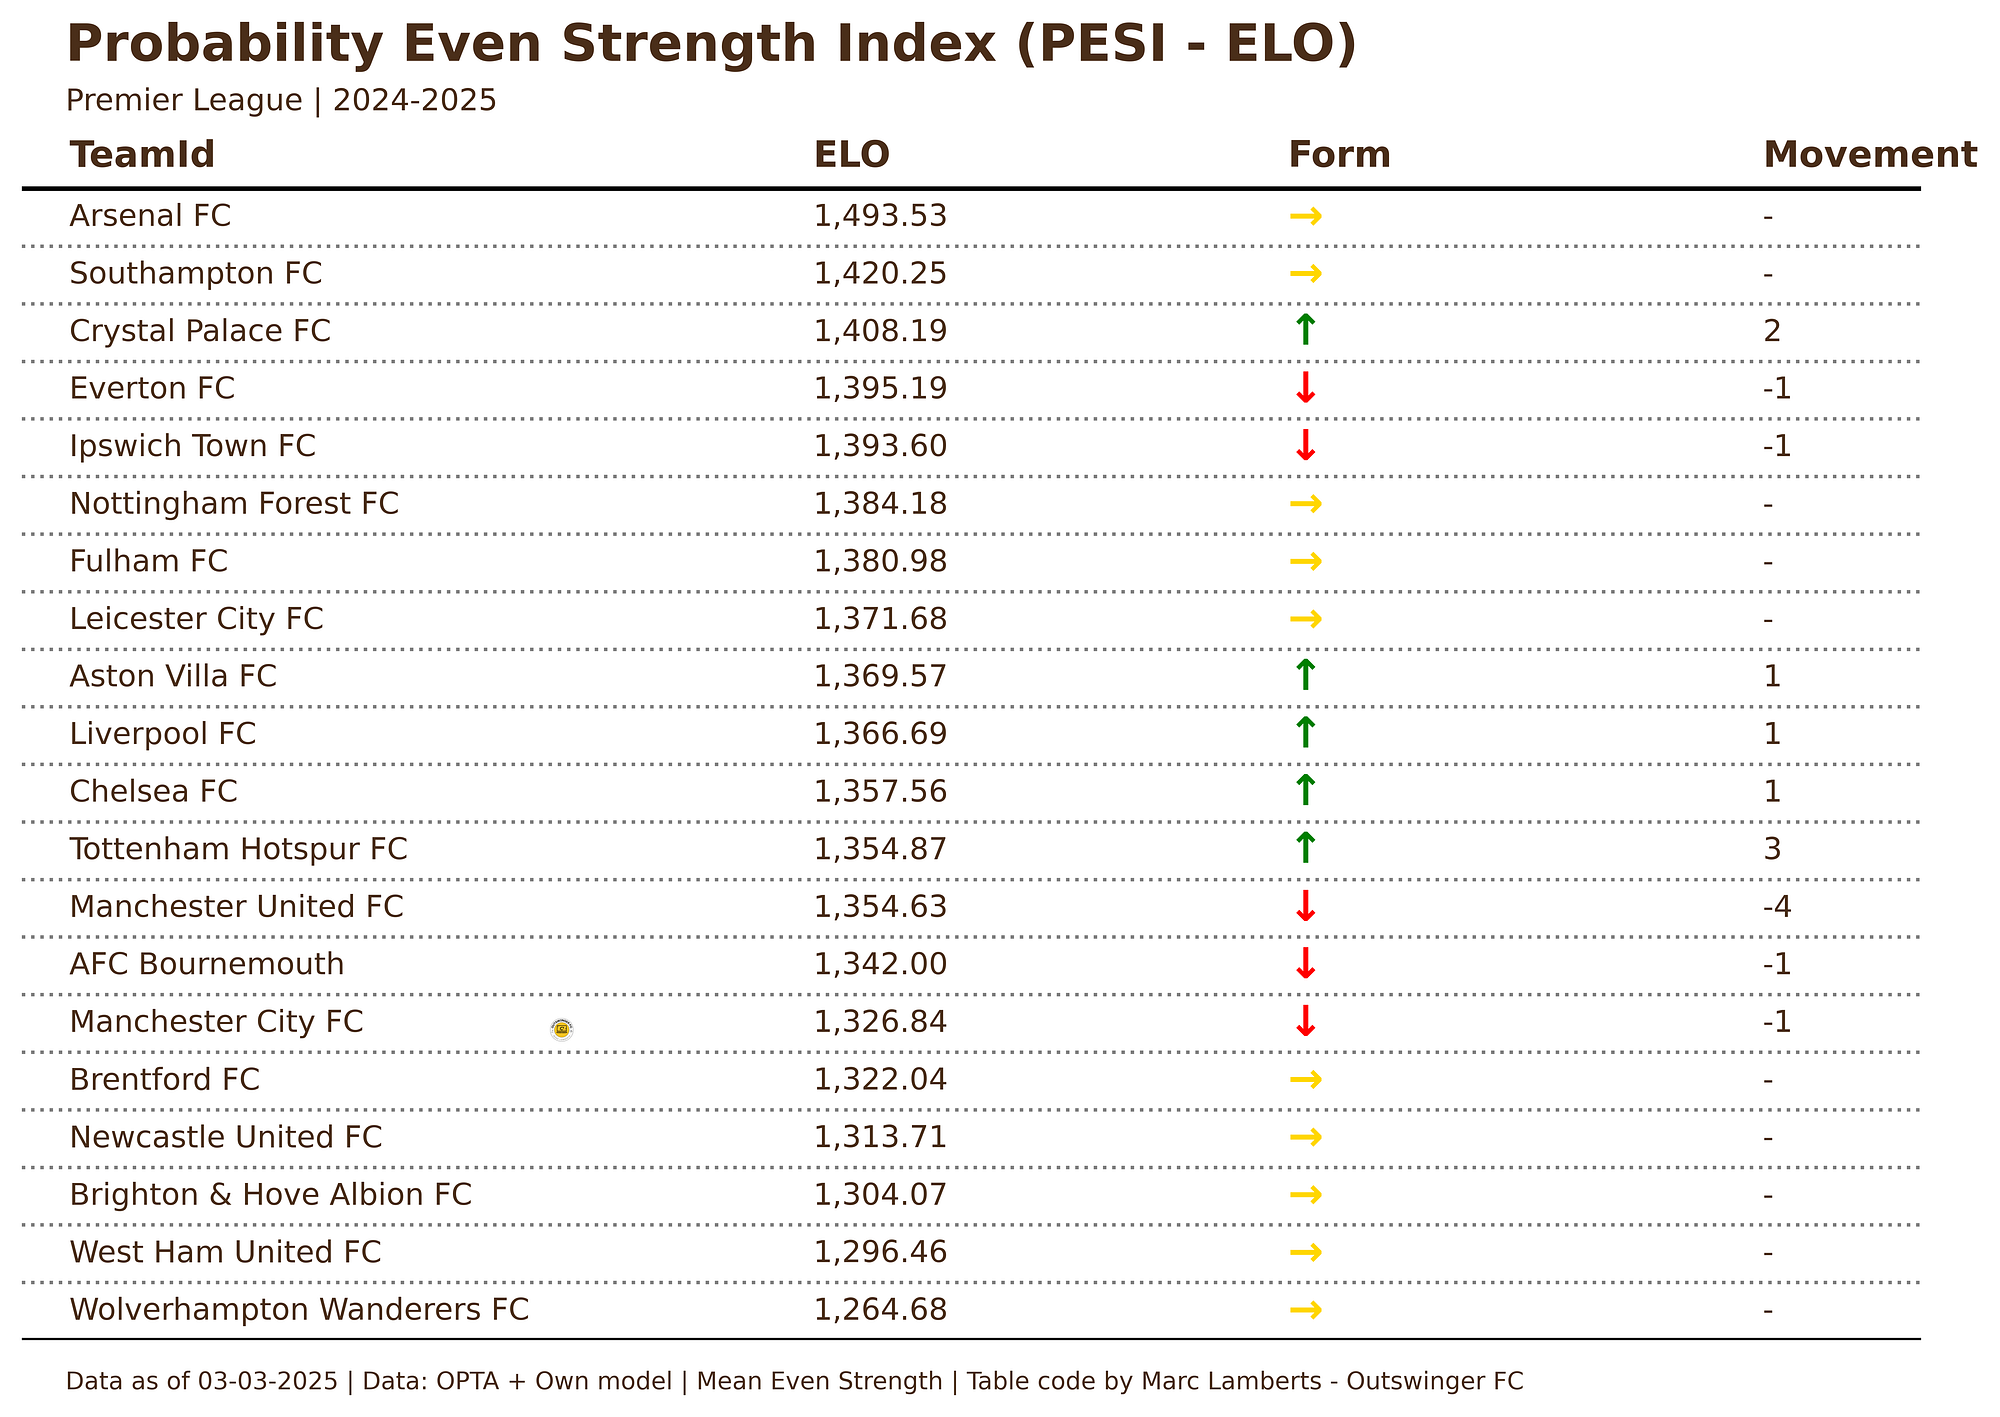
When you look at the table above, you can see that Arsenal has the highest ELO, followed by Southampton and Crystal Palace. The lowest are Brighton, West Ham United and Wolverhampton Wanderers. This doesn’t mean they are the best or the worst; it just means that they score high or low on creating/generating expected goals in even-strength situations.
Challenges
There are two big challenges for me, and something I need to address the next time:
- Even Strength is an interesting concept, but I am looking at two main variables: game state and regular play. Dismissing losing or winning state and set pieces and counter-attacks. However, this only looks at shots, I forgot to include even state for numerical even strength. It happens that red cards are given or teams have no more substitutions with injuries. That’s something you need to do in the next model.
- A vital part of the concept is that good-performing teams often lead and, therefore, are not in creating/generating xG from even strength situations. Bad teams have the same issue, as they are often in losing situations; this is something that needs addressing in the next mode,l too.
Final thoughts
This model blends MESH Strength Score and ELO ratings to track player and team performance in a more meaningful way. MESH goes beyond basic data like goals and assists, factoring in consistency and overall influence in different game situations. Meanwhile, ELO provides a way to rank teams dynamically based on how they perform against their opponents. Together, they create a more complete picture of performance rather than just relying on wins, losses, or raw numbers.
Since ELO adjusts based on competition strength, it also makes comparing teams over a season more reliable. This method could even be useful for forecasting match results based on past performances. In the future, Glicko-2 could be a strong alternative, as it builds on ELO by incorporating rating volatility, meaning teams with inconsistent performances would see their ratings fluctuate more, while stable teams would have steadier rankings. This could provide an even clearer picture of team strength and performance trends over time.
That said, it’s not without challenges. The accuracy depends on solid data, the right balance of weighted factors, and accounting for outside influences like injuries or tactics. With refinements, though, it could become a valuable tool for deeper football analysis.
Geef een reactie